Production Decision Intelligence
From line event data to defensible throughput decisions
— in minutes, not months.
ReliaSim ships with the modeling team built in. No simulation department required — validated within 1% of measured OEE.
Confident choices, better outcomes.
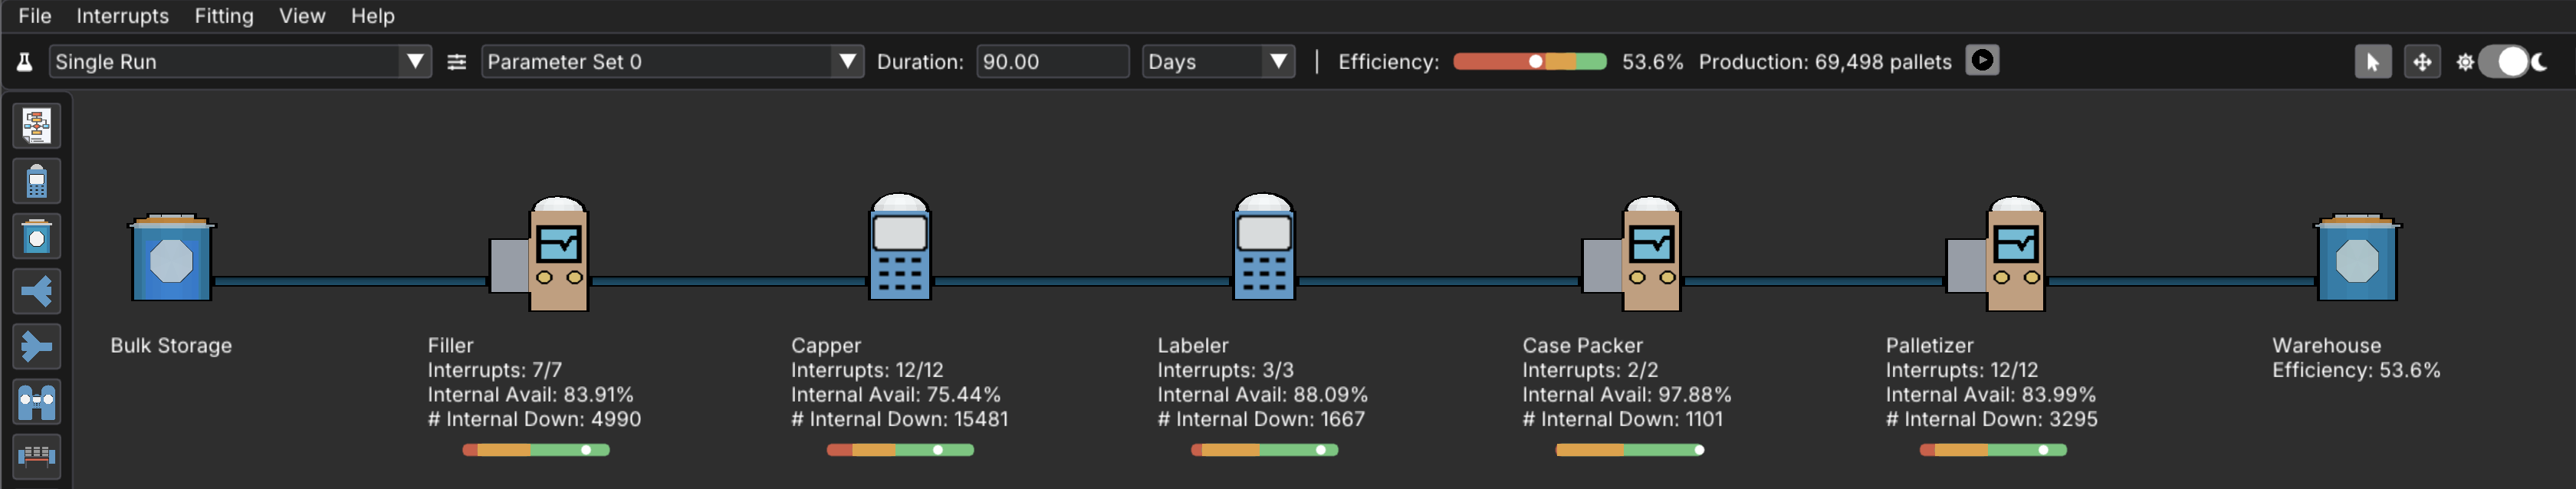
15-minute model build
Validated within 1% OEE
Runs on your desktop · air-gap compatible
Independently validated within 1% OEE accuracy — Tom Lange, 36 years Procter & Gamble