Feed your historian data to to find the distributions that best fit each machine's failure behavior.
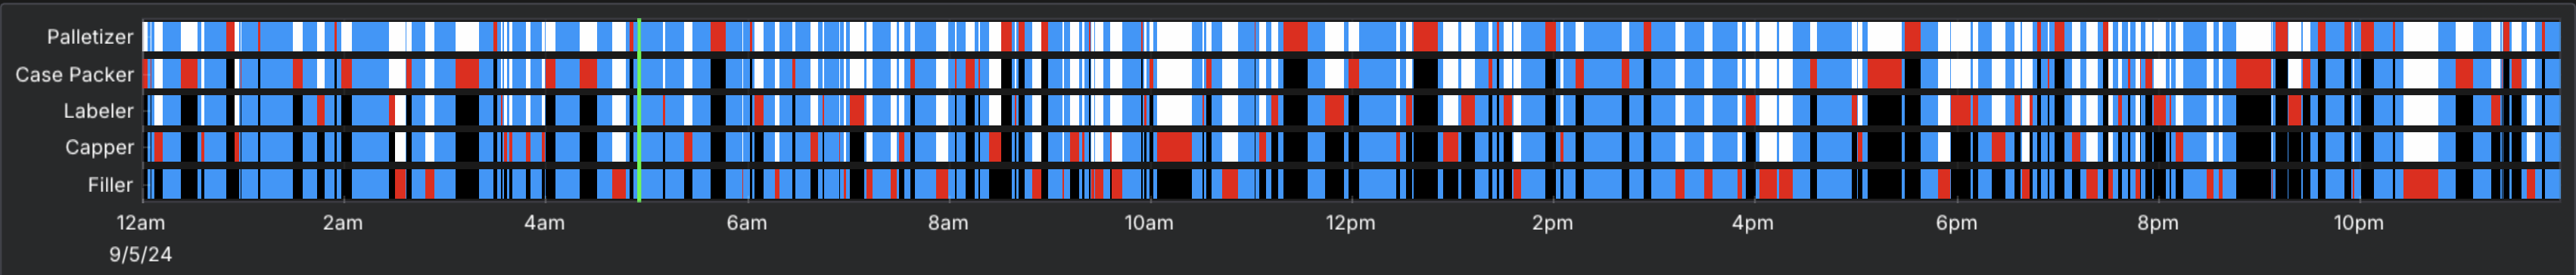
Historical Line Event Data — blocking and starving emerge from the interaction
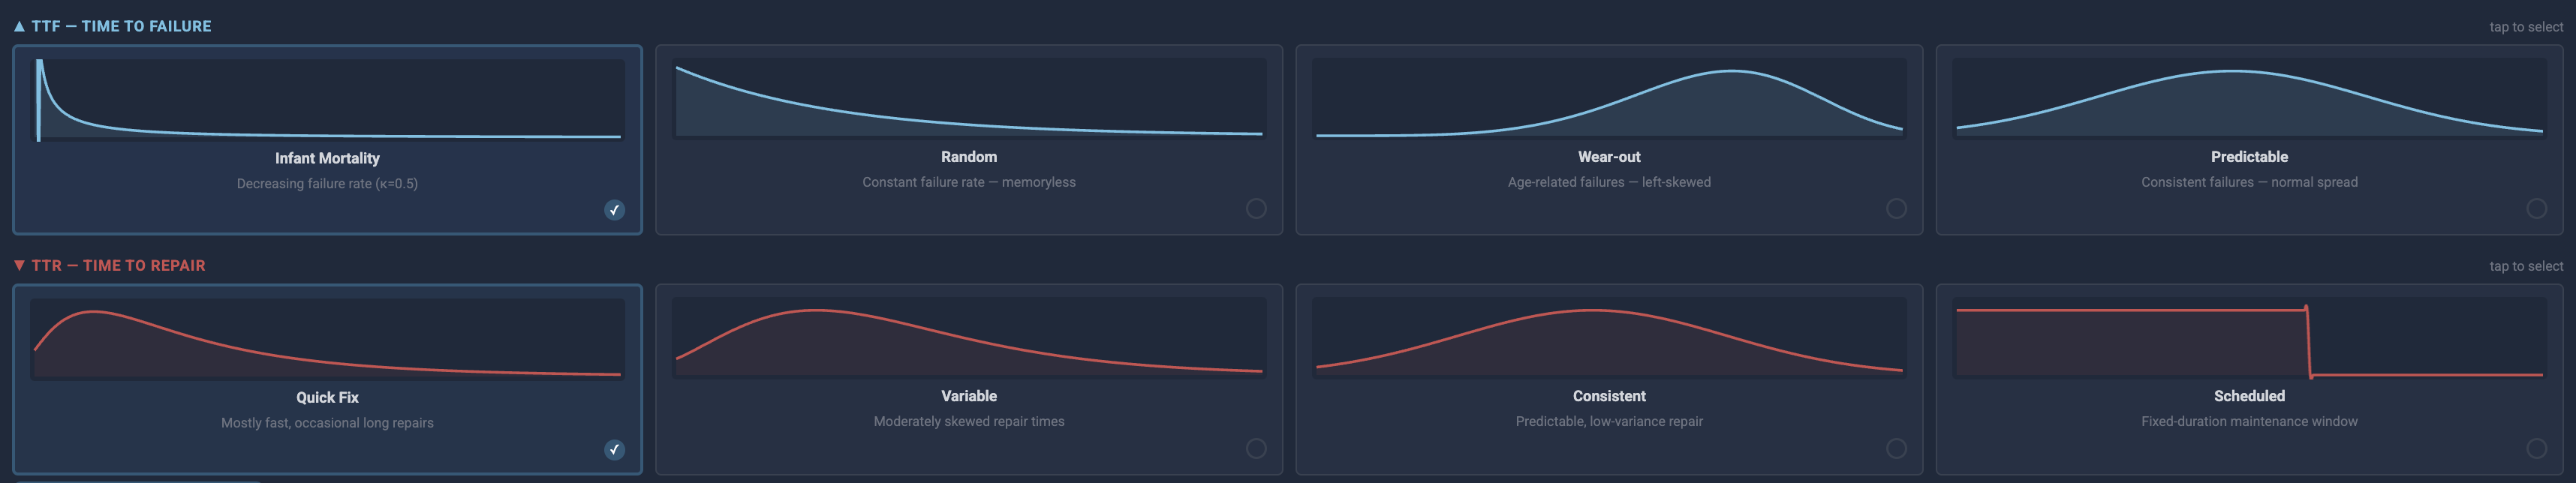
For systems without data, the Interrupt Designer guides your distribution selection based on your reliability process.
Interrupt Designer — select uptime and downtime distribution shapes
Step 3
Simulate your baseline.
Evaluate your system with eyes wide open to its range of outcomes.
Any durationRandom seed analysisSingle runMultiple runs
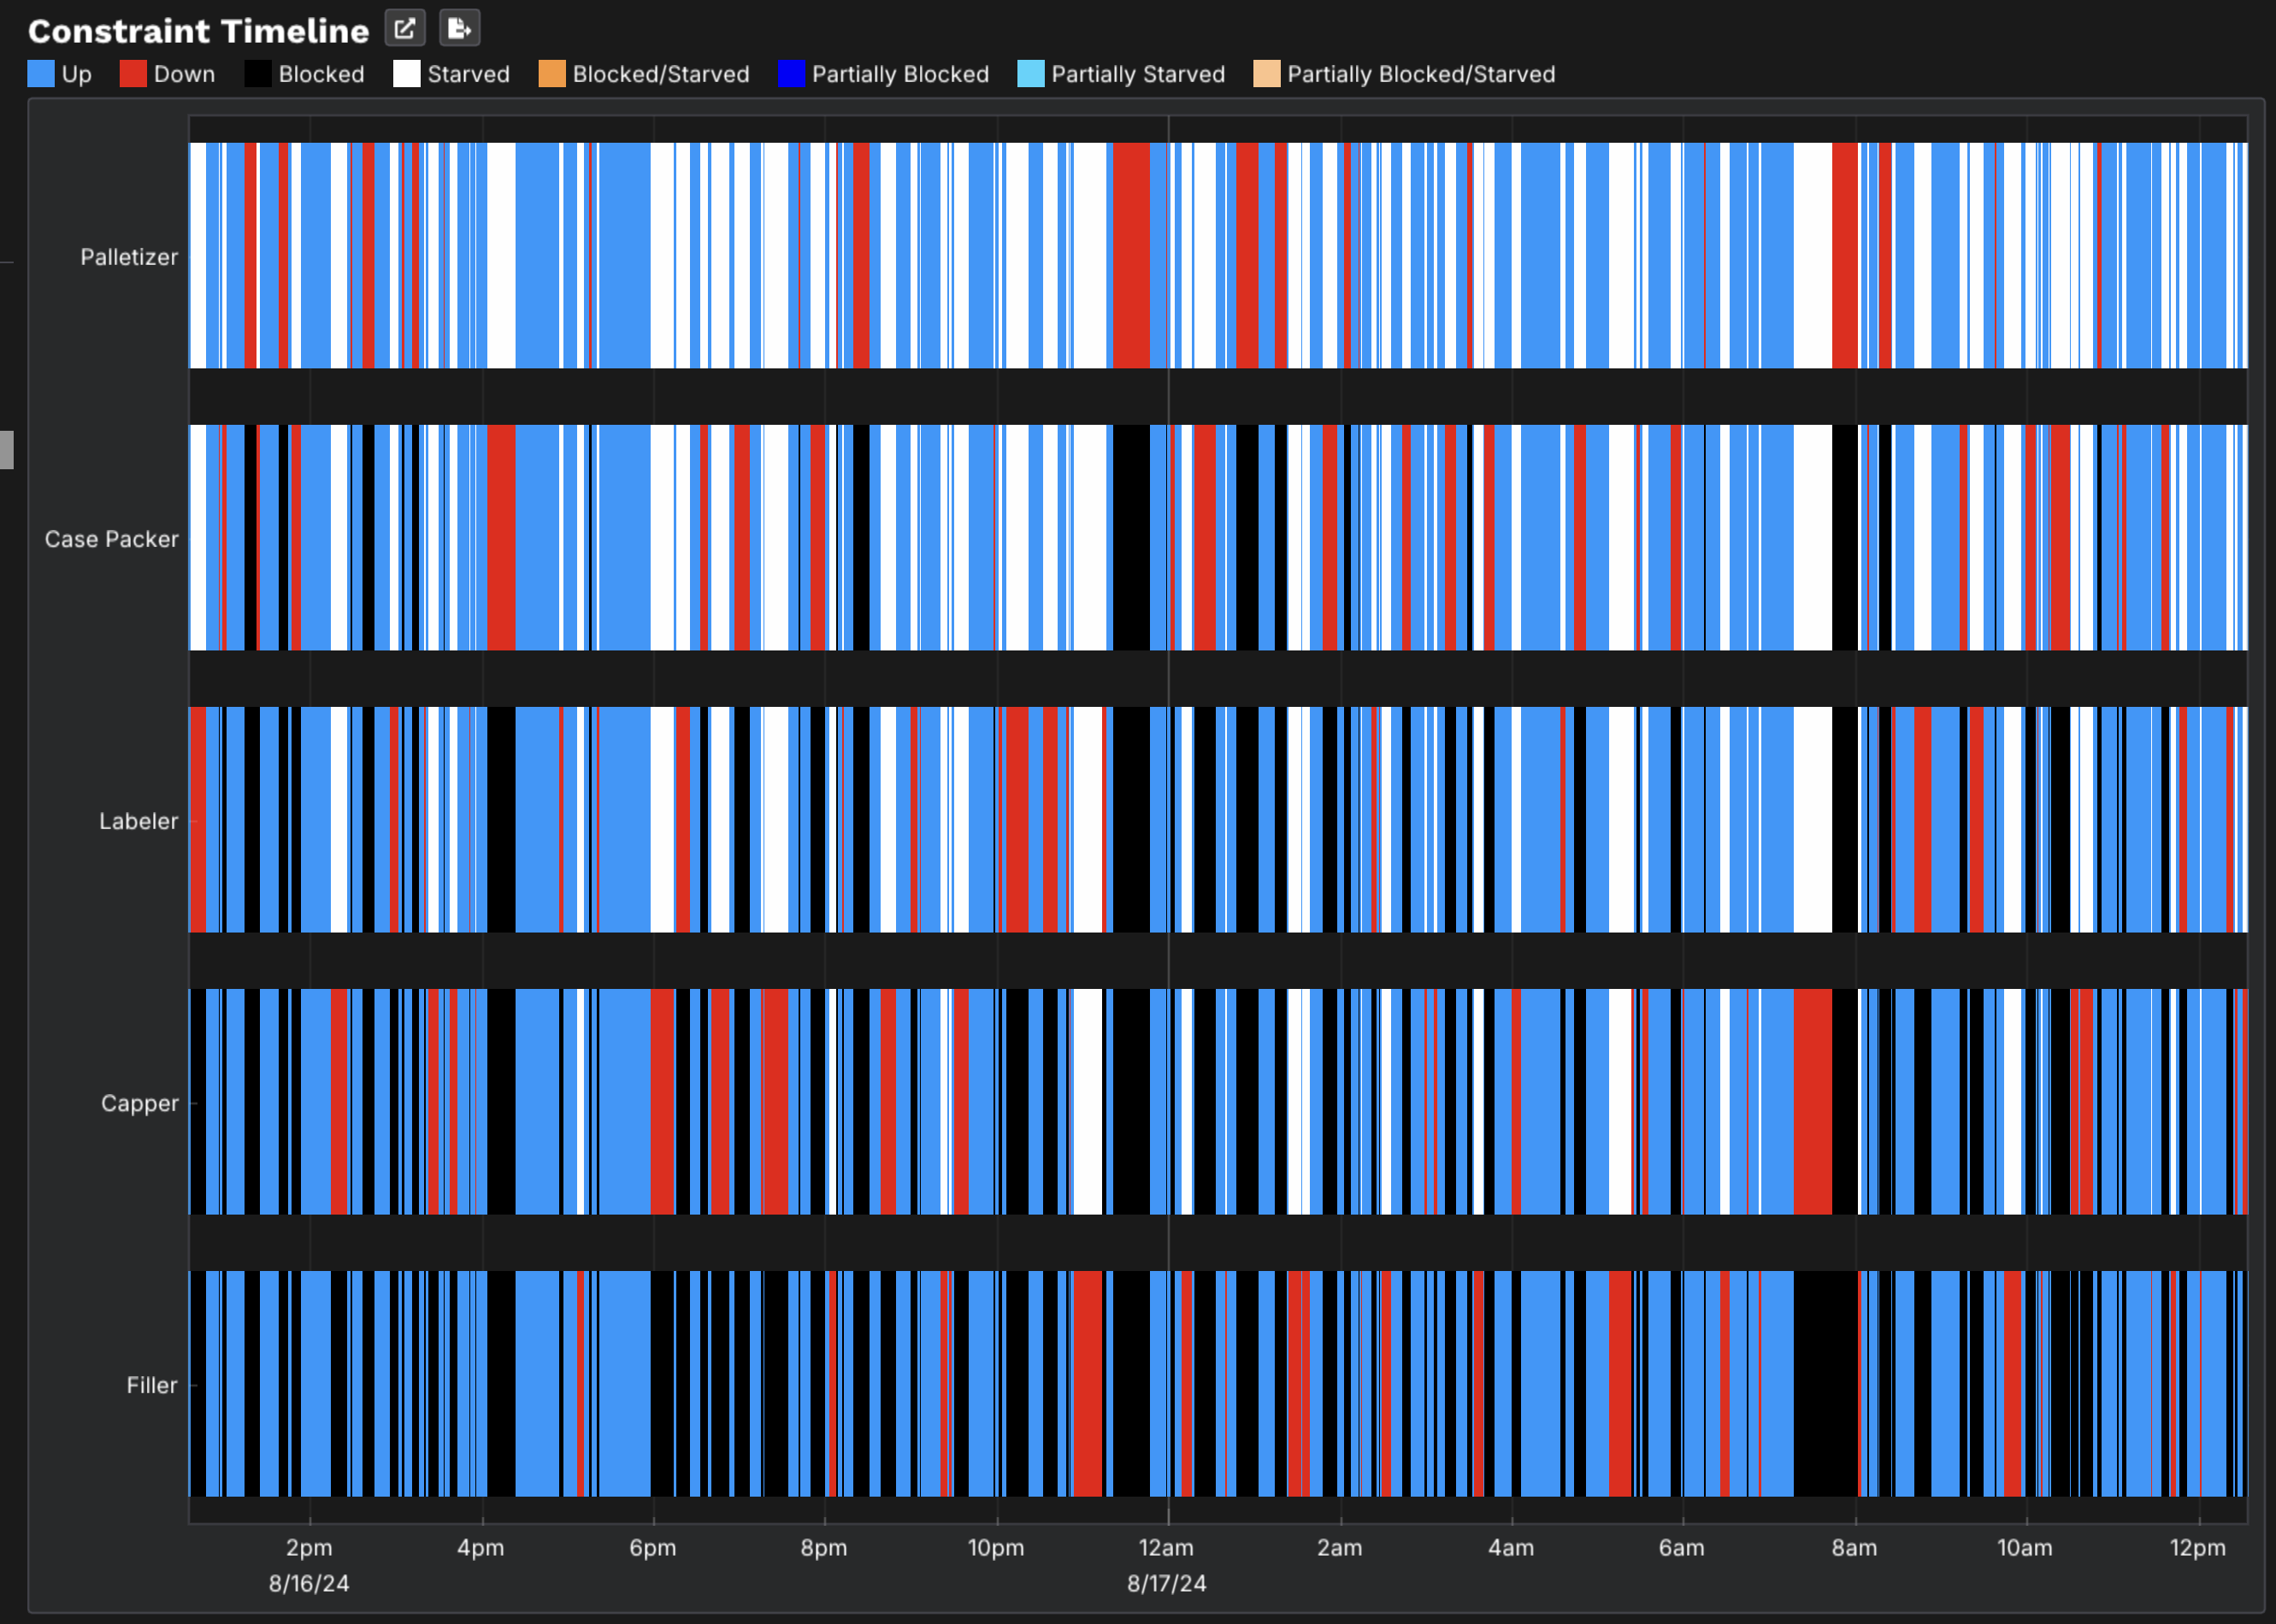
Constraint timeline
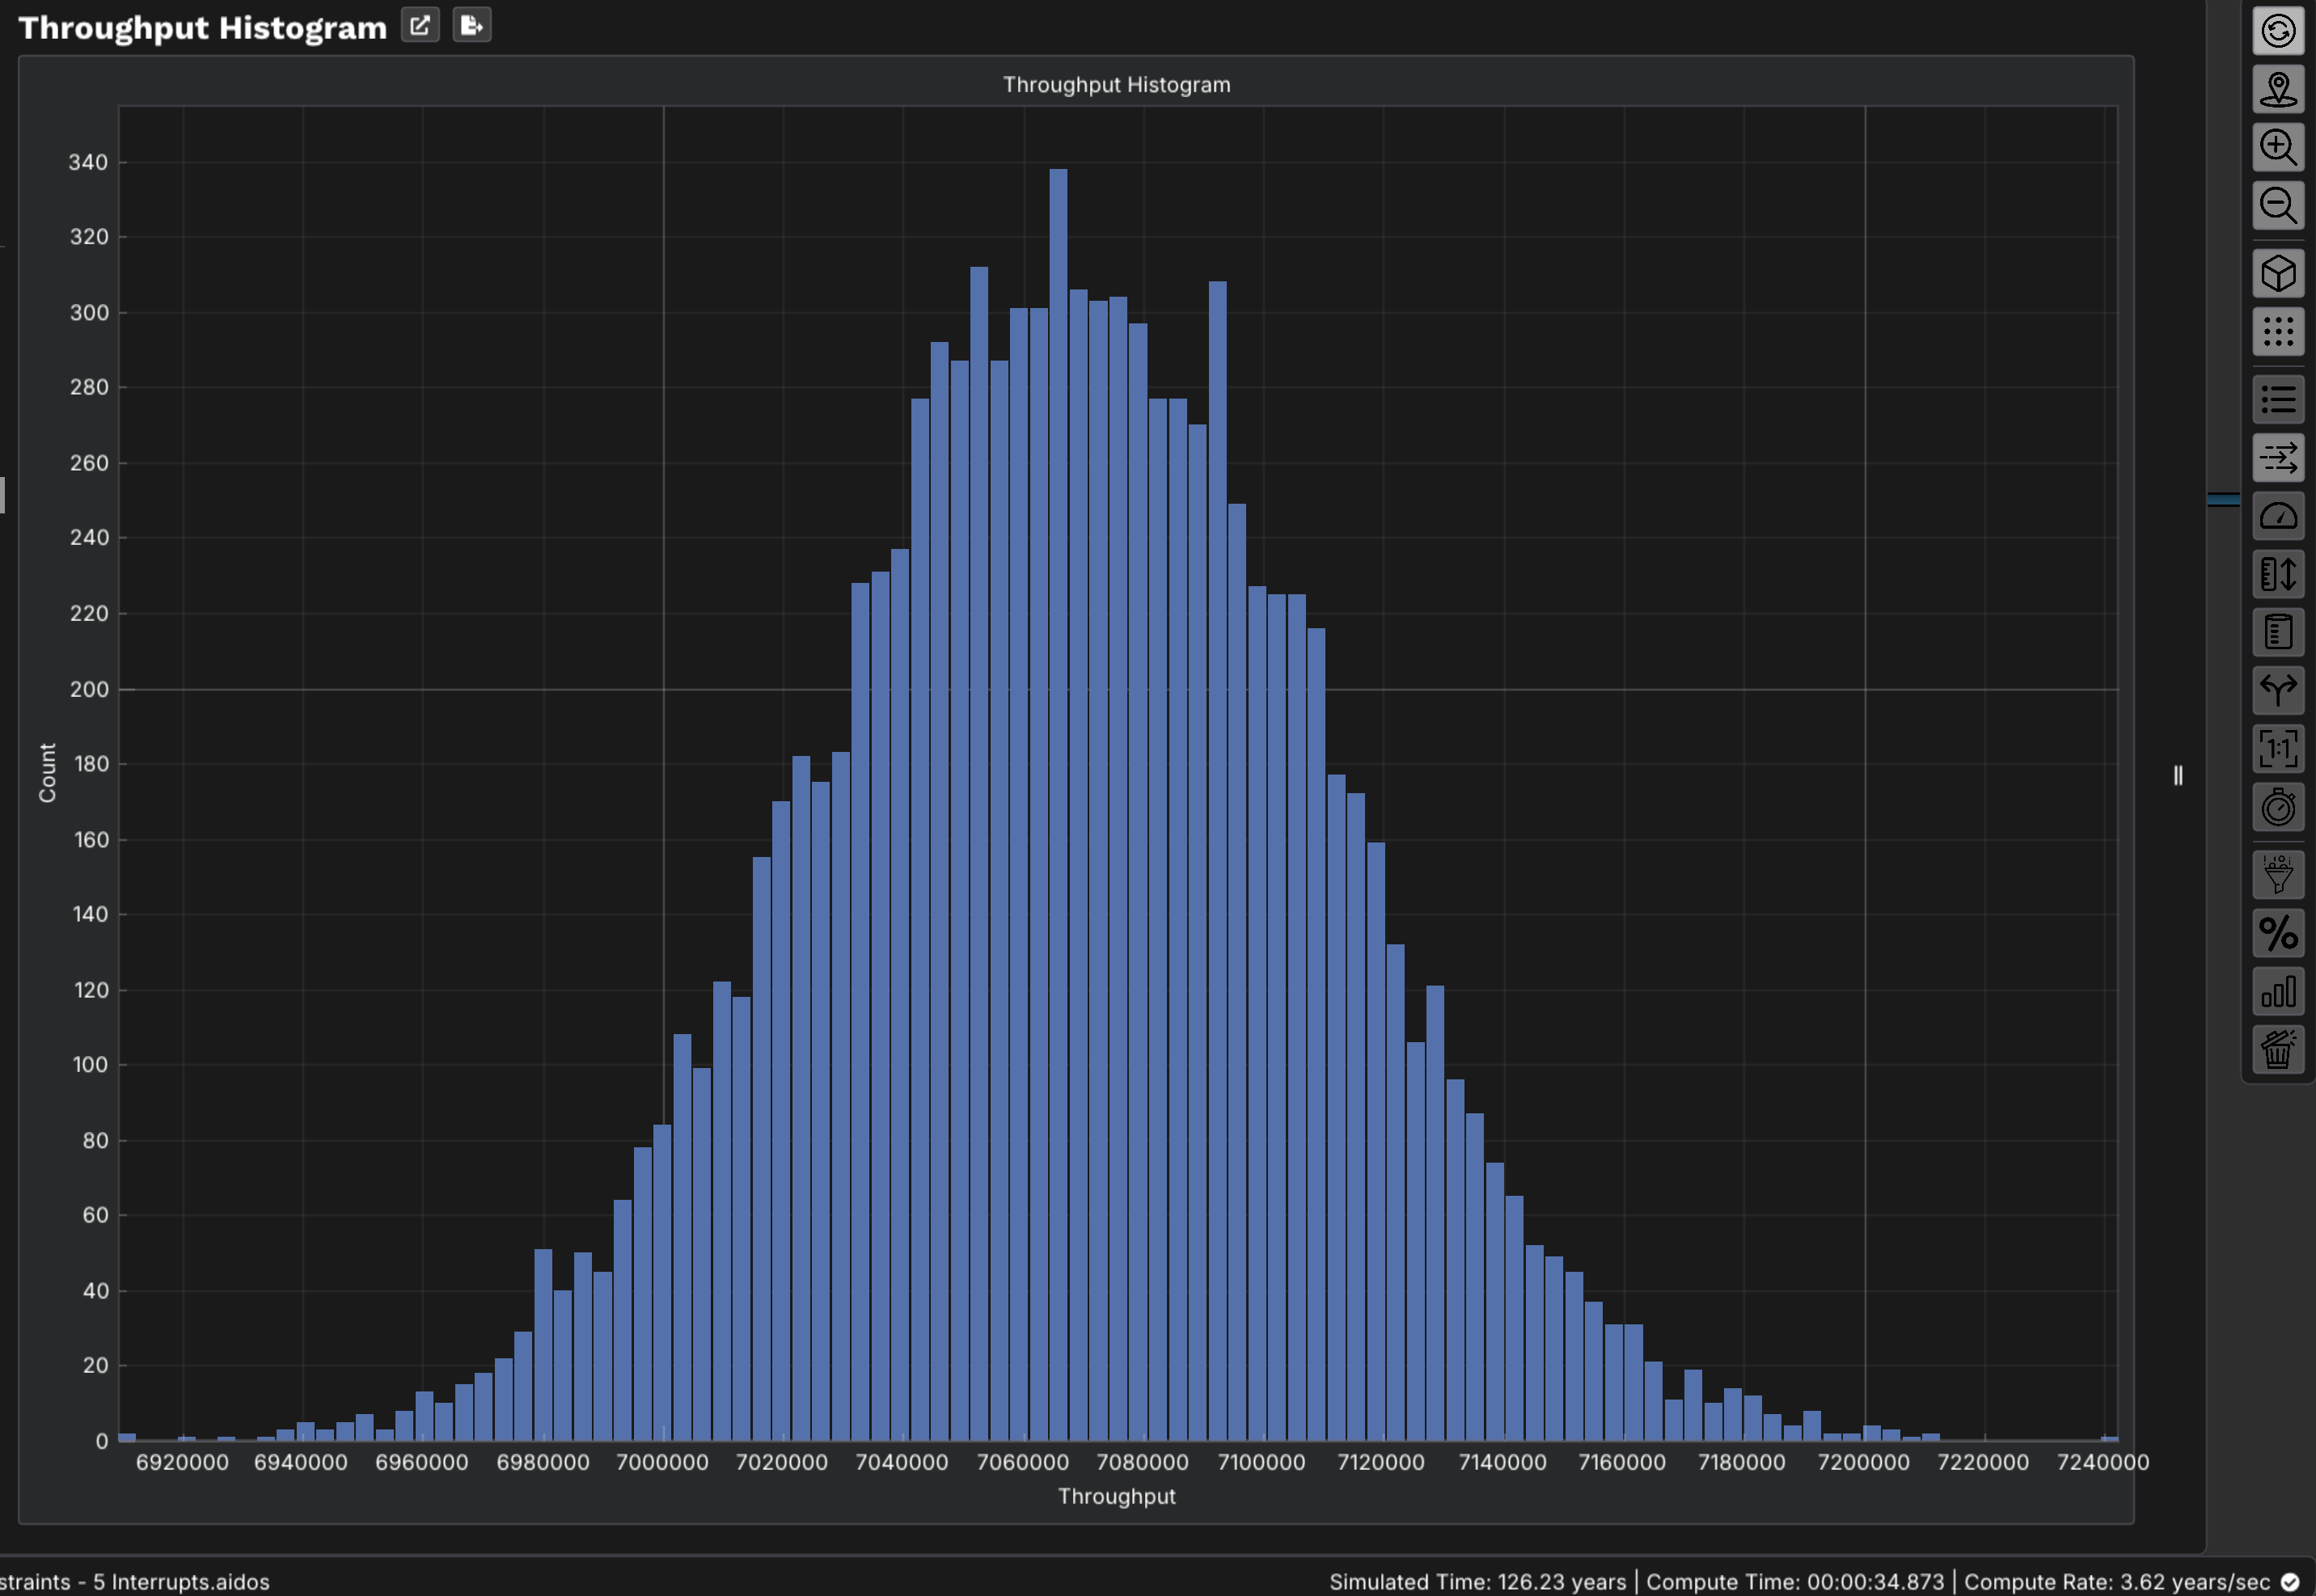
Throughput distribution
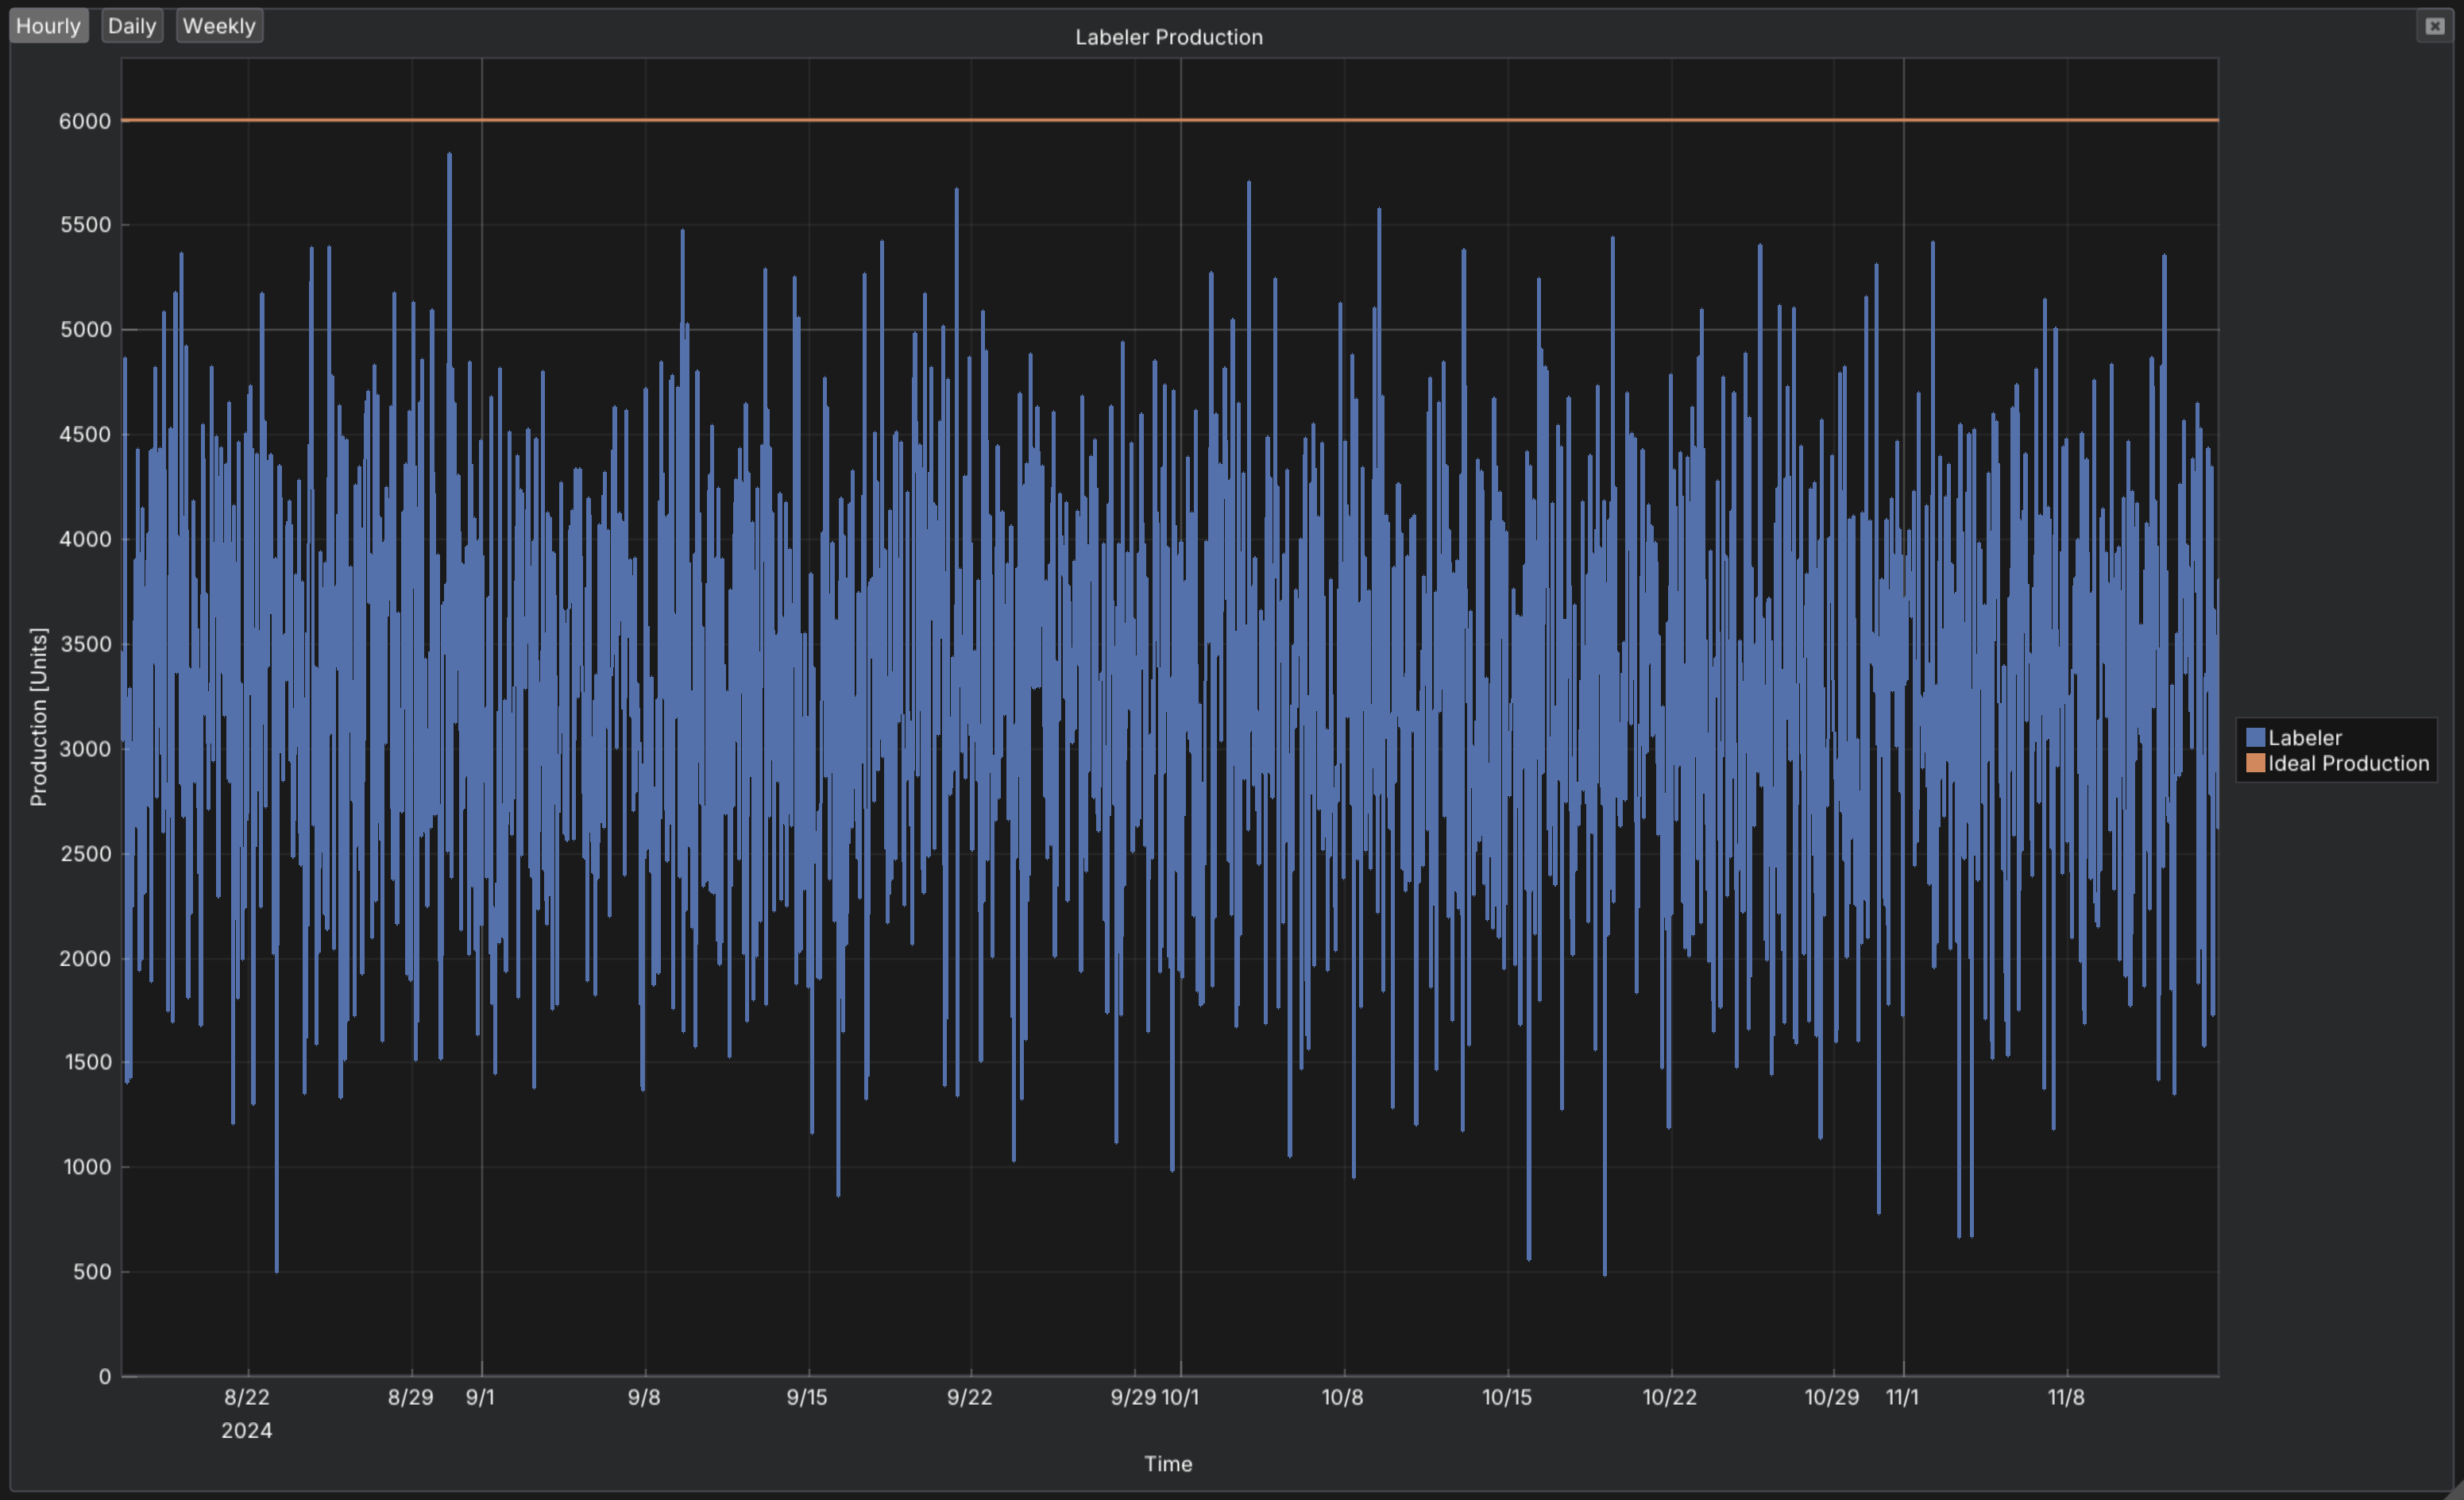
Production vs. ideal
15 min
To build & run
1,200×
Faster than traditional
Step 4
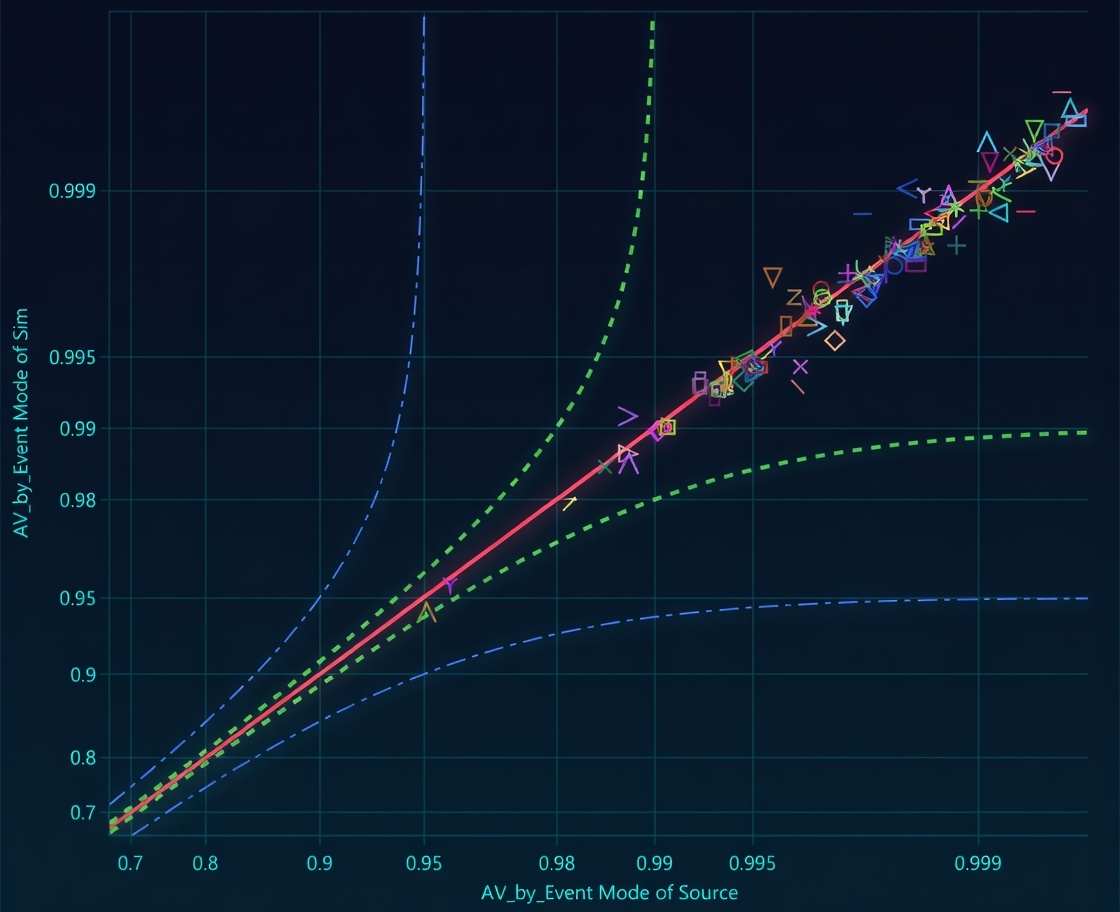
Validate against history. Within 1%.
Model vs. historian — simulated availability vs. actual
Each point is an interrupt. On the diagonal = model matches reality.
"The only way to predict this accurately is through simulation."
— Tom Lange, 36 years Procter & Gamble
Step 5
Experiment & Compare.
Labeler Misalignment
Infrequent, longer stops
Loss6.78%
Higher direct loss
Filler Micro Stop
Frequent, short stops
Loss6.67%
Lower direct loss
Similar direct losses. Your Pareto says: similar priority. Eliminate each one and measure the whole system.
Step 5
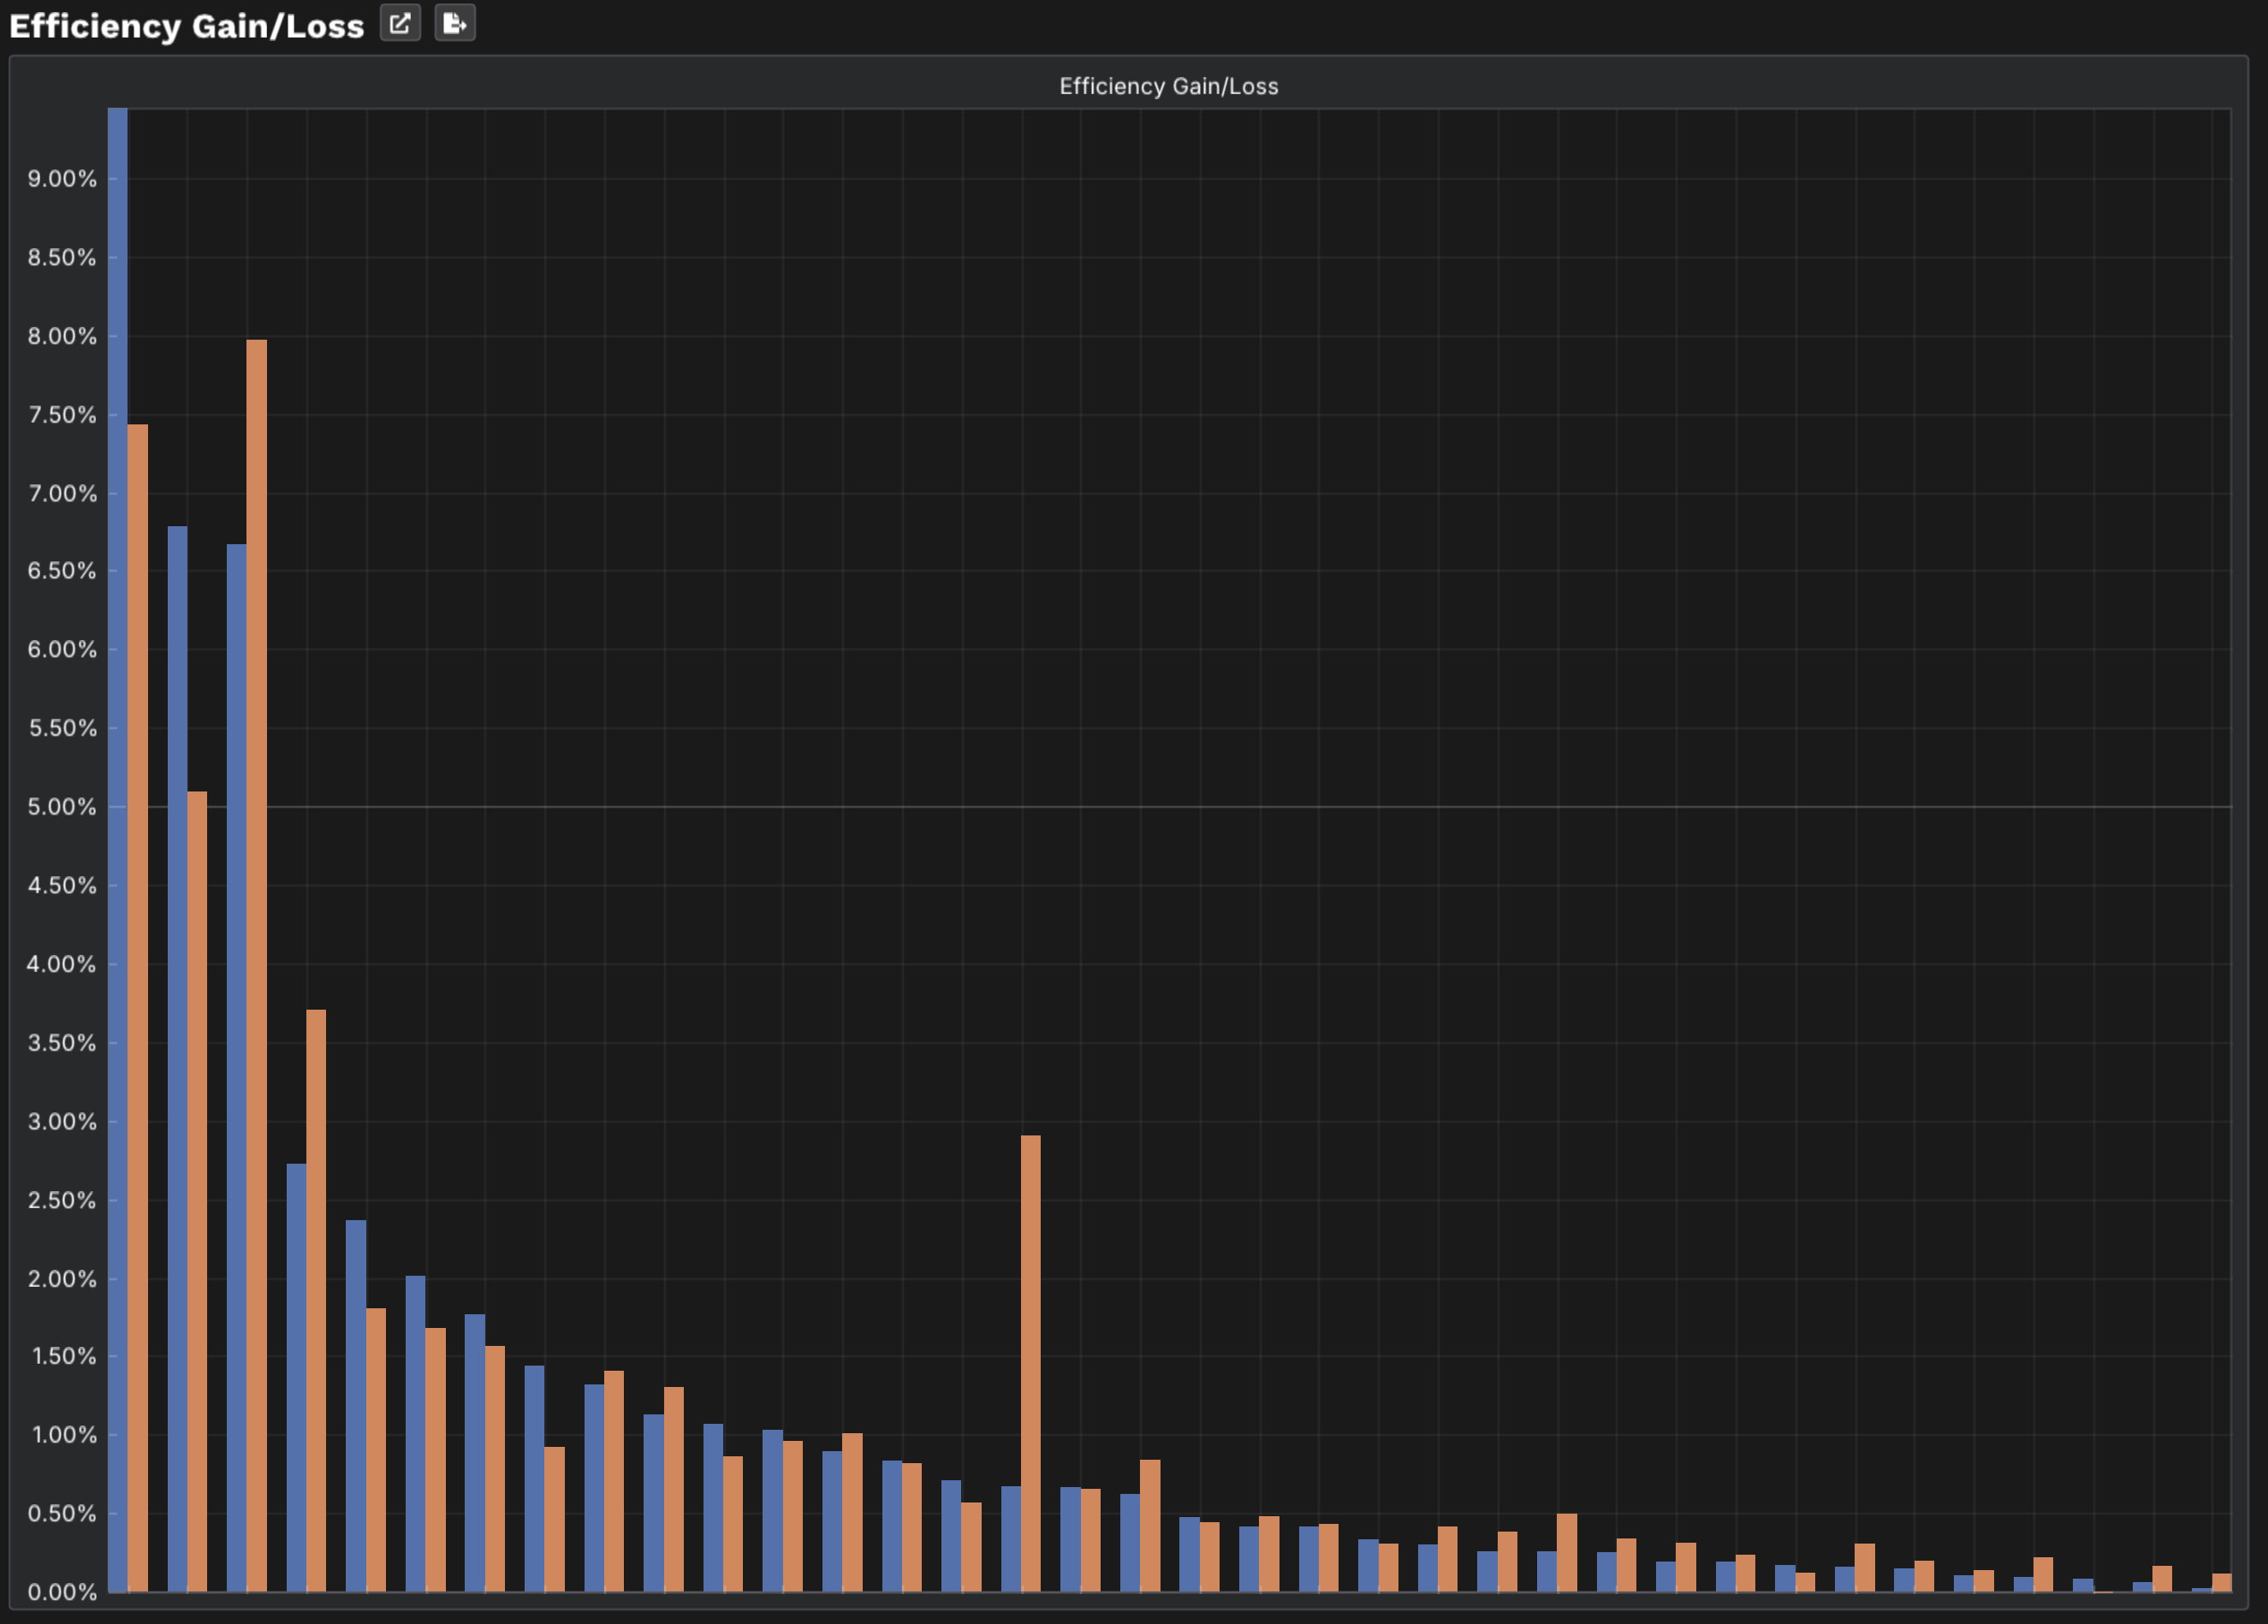
Gain≠Loss.
Efficiency Gain/Loss — evaluate each interrupt, one at a time
Labeler Misalignment
0.75×
Loss6.78%
Gain5.10%
Filler Micro Stop
1.2×
Loss6.67%
Gain7.97%
Step 5
Frequent short stops cascade.
120 one-minute jams stress the entire system. Losses appear under other machines' names — invisible in your Loss Tree.
Full line dynamics — blocking and starving are emergent
"Those 120 one-minute interruptions create cascading problems that don't show up under the original problem's name. You often recover 180–220 minutes — significantly more than the 120 minutes of downtime."
— Tom Lange, 36 years Procter & Gamble
Step 6
Make confident decisions.
No expensive consultants required. The expertise is built into the system. Here are the decisions your validated model answers.
🔧
Which failure first?
Rank by system gain, not downtime.
⚡
Faster or slower?
Faster = more product, more failures.
📦
How much buffer?
Protect the bottleneck — but how much?
🔁
Second machine?
Redundancy vs. reliability improvement.
🔄
Manual or auto resupply?
True cost is often 3× what downtime says.
🎯
Your question here.
Every line has its own version.
+
See the impact of change before you make it.
~1%
OEE accuracy
15 min
Model construction
1,200×
Faster than traditional
300+
Organizations
"It runs on my desktop. No integration, no IT project, no waiting."
— Plant Manager, Food & Beverage
Tom Lange & Andrew Siprelle — Executive Platforms Blueprint Podcast
ChiAha — Advanced Analytics & Automation Group · chiaha.com
 Source
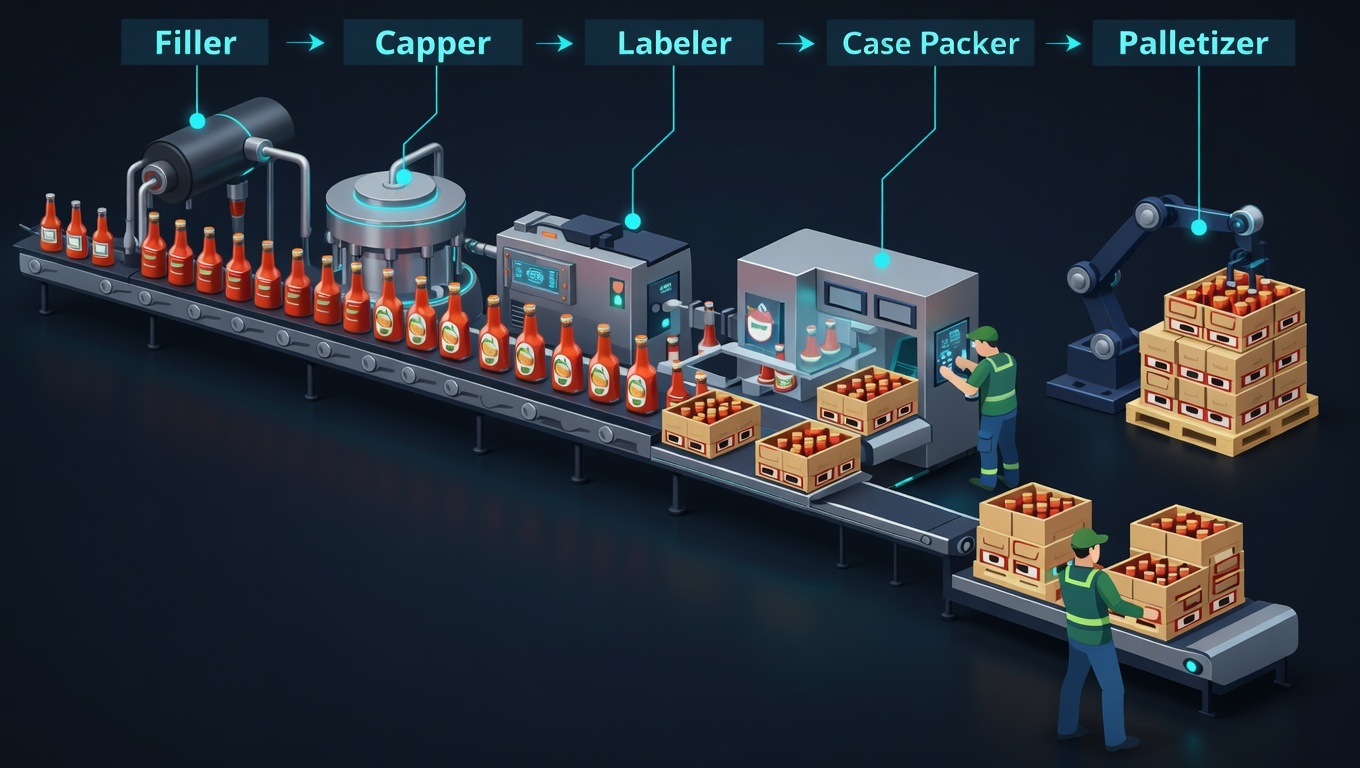
 Filler